
Palmer’s Prowess
A more personal project, during the 2023/24 EPL season I - like many Chelsea fans - were amazed by the output of new signing Cole Palmer. I decided to look into it more, and subsequently made the following graphics to display his excellent performance.
All stats were retrieved from fbref.com and visuals made on Tableau.

Though it was visually clear by watching Chelsea that season how influential Cole Palmer was to the entire team, I downloaded the stats and visualized them on Tableau.
The above Bar Graph demonstrates how much higher Palmer’s output was in comparison to the team, registering 22 goals and 11 assists throughout the Premier League campaign. His next closest competitor, Nicolas Jackson, registered 14 and 5 respectively by comparison.
The Pie Chart on the right highlights that Palmer attributed for a little over a quarter of all of Chelsea’s goals and assists (G+A) that season.
Discovering and viewing these statistics led me down two further paths, to compare Palmer’s numbers both to other players that season throughout the league and players from Chelsea’s past.


Palmer found himself leading the league for G+A with his total of 33. The above graph displays total G+A for the top 50 players in the league that season. Below displays each team’s highest G+A player, again demonstrating Palmer’s supreme standing atop the league.

One question I had when reviewing the data was to wonder if Palmer was the most influential player to his team in the league, and surprisingly the below graphic points to the contrary.

Wolves’ Matheus Cunha was instead the player most pivotal to their team that season, accounting for a staggering 40.4% of the team’s G+A. Palmer meanwhile finds himself 12th in this list at 26%, demonstrating that though he may seem so pivotal to Chelsea, in comparison to the league over half the other teams have an individual player accounting for more of their G+A.
Finally, I wondered how Palmer’s season stacked up against past Chelsea players. Thanks to fbref, I was able to retrieve the data and compare Palmer’s numbers to Chelsea players since 2000. This resulted in a total number of 635 individual player seasons and, after some analyzing and visualizing, created the below graphic.
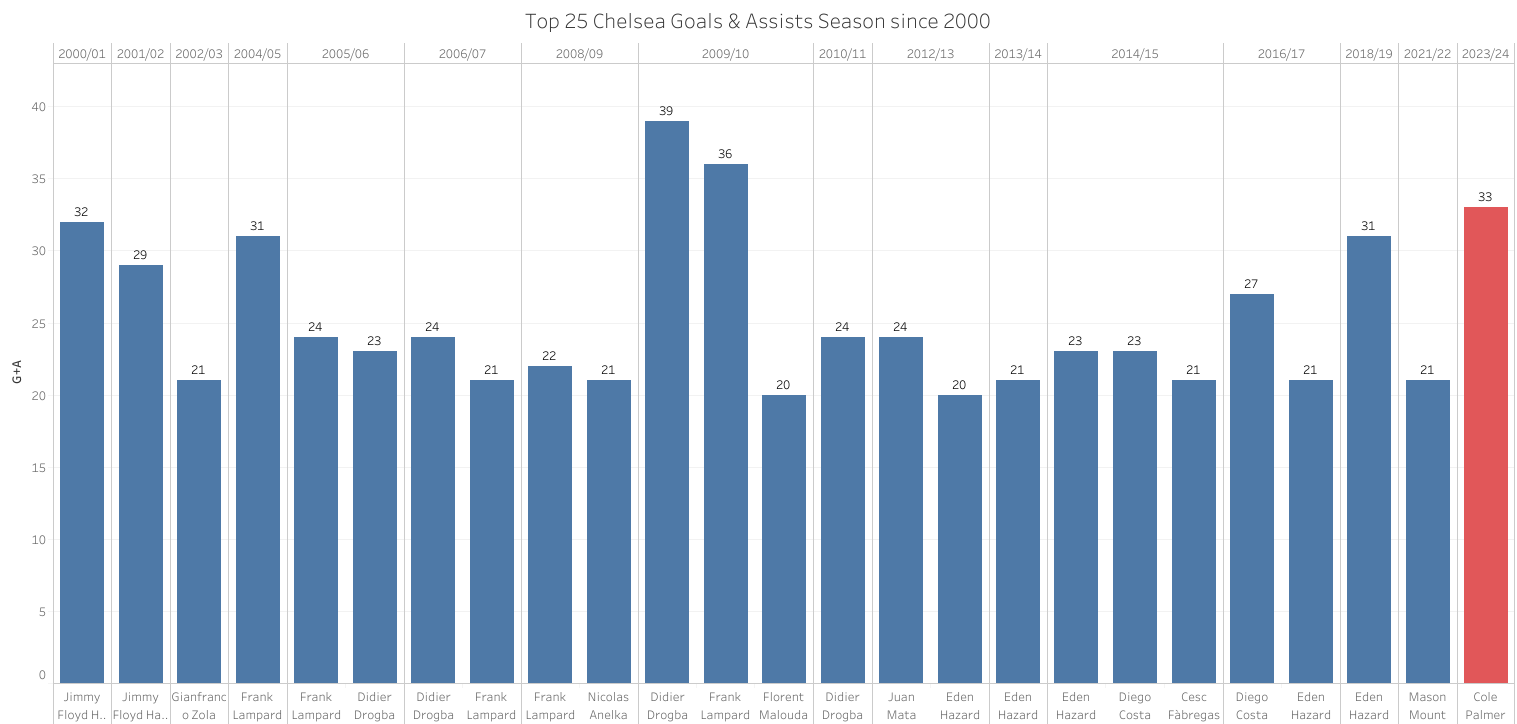
Cole Palmer’s 2023/24 season put him third on the list of Chelsea players’ G+A since 2000 - a staggering achievement, and coming third only to two standout performances during Chelsea’s record-breaking 2009/10 season. What makes this feat even more impressive is that Palmer achieved this in his debut season for Chelsea, which resulted in me analyzing one final piece of data and creating this final graphic

Palmer had the best debut season for a Chelsea player since 2000 for G+A. A quick review of further data shows that no Chelsea player ever achieved such numbers since 1992 (when the Premier League was founded), so it is also the best debut season of any Chelsea player in Premier League history.
The Process
I started this project by first proposing what I wanted to learn. In lieu of a real-life business problem, I instead wanted to gain insights of Palmer’s season statistically, both in the current season and historically.
Next, I visited fbref to obtain both the data across the league for 2023/24 and data for Chelsea players for all seasons since 2000. The data was neither easily exportable nor all in one place, so a lot of data verification and cleaning was required.
I then analyzed the data, spotting trends that will address the ‘business problem’ and deliver valuable insights.
Finally, I used Tableau to create the above visuals to demonstrate the points I wished to make to any important stakeholders, who in this case were just myself and fellow Chelsea fan friends. They were impressed by Palmer’s numbers in comparison to historical Chelsea greats, as well fascinated by how his performance stacked up against the league. For them, it was easy to learn the valuable insights from the visuals I created on Tableau, but were a result of a long process of data cleaning, analyzing and visualization from myself.
Summary
I started this project when I first got into data analysis, and wanted a case study to test out the various features on Tableau. Nevertheless, it enabled me to learn valuable data analysis skills and lessons which can be used in my career going forward. For example, it was a common-held belief amongst fans that Chelsea were a ‘one-man-team’ that season, that Palmer carried the team. However, analyzing the data showed that Palmer was instead just 12th in the table for percentage of teams’ total G+A accounted for by one player - highlighting the requirement of any data analyst to hold no bias or beliefs before analysis!